Build, debug, profile and diagnose your code using .NET tooling
Why it matters
As a dynamic, interpreted language, PHP has a clear advantage in terms of ease of development and speed of making changes. However, on the flipside, there are significant gaps when it comes to debugging and analysis tools, even though there are some great projects, e.g. PHPStan, that mimic these processes.
What you get
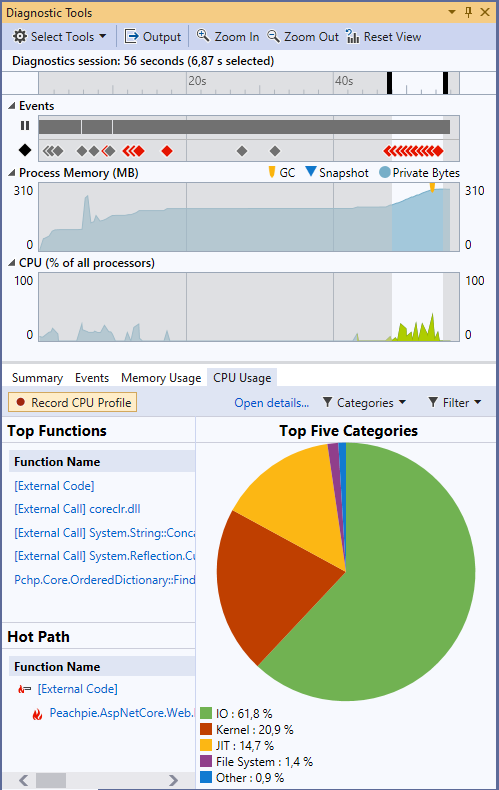
When you compile your PHP to .NET with PeachPie, you can take advantage of the powerful .NET tooling and ecosystem that naturally becomes available to you when you develop on top of the PeachPie platform. Thanks to PeachPie, you can debug and profile your PHP code right in Visual Studio, VS Code, or Rider and get insightful diagnostics during design time. Your PHP code is compiled into a DLL file and may be packed into NuGets, which can be distributed securely without the source code itself.
With the PeachPie project, .NET tooling will understand your PHP code. The project can be opened in Visual Studio, or built on the command line with .NET CLI. Continuously building the project reveals diagnostics with detailed information. This process is well supported by .NET continuous integration platforms like Azure DevOps, AppVeyor, and by .NET development tools like Visual Studio.
Since the PHP application runs natively on .NET, developers will take advantage of the entire diagnostic tools, performance profiling tools, exception handling, analytic tools, debugger, and remote debugging capabilities.

Case in point
A client of ours from the e-commerce sector was struggling with the amount of bugs and performance bottlenecks in his legacy PHP codebase. By developing on top of the PeachPie platform, they were able to step through the code right in Visual Studio, reveal all kinds of errors and warnings, and profile the app using the built-in .NET profiler.
References:
-
Project file reference
How to set up your MSBuild project file - the basic
XMLfile that describes the build process and other properties.